GAIA ALLSKY EXPERIMENT

Real Star Catalog · One Star One Pixel · No Milky Way Overlay

600 million real stars,
one by one, painted back into the sky.

ESA's Gaia mission measured the positions, brightnesses, and colors of 1.8 billion stars in the Milky Way. For this patch of sky over Guangzhou, we take every measured star down to magnitude 20, about 600 million in total, and draw them onto the celestial sphere one by one. The Milky Way is not painted separately: once the stars become dense enough, it emerges on its own. Then we add light pollution level by level, so you can watch it disappear step by step.

6.0×10⁸
measured stars
Bortle 1–9
dark sky to city center
G ≤ 20.0
limiting magnitude · Guangzhou 23.1°N

Data source · ESA / Gaia Mission DR3 · European Space Agency

A full Milky Way rendering at Guangzhou's latitude under assumed zero light pollution, with stellar granularity and dark dust lanes clearly visible
R.A. 18ʰ41ᵐDEC −04°12′
Guangzhou latitude · assumed zero light pollution — every point in the image is a real cataloged star, and even the central dark lane comes from real data
01Why / WHY THE MILKY WAY VANISHES

Cities lose the Milky Way,
not the stars.

i.

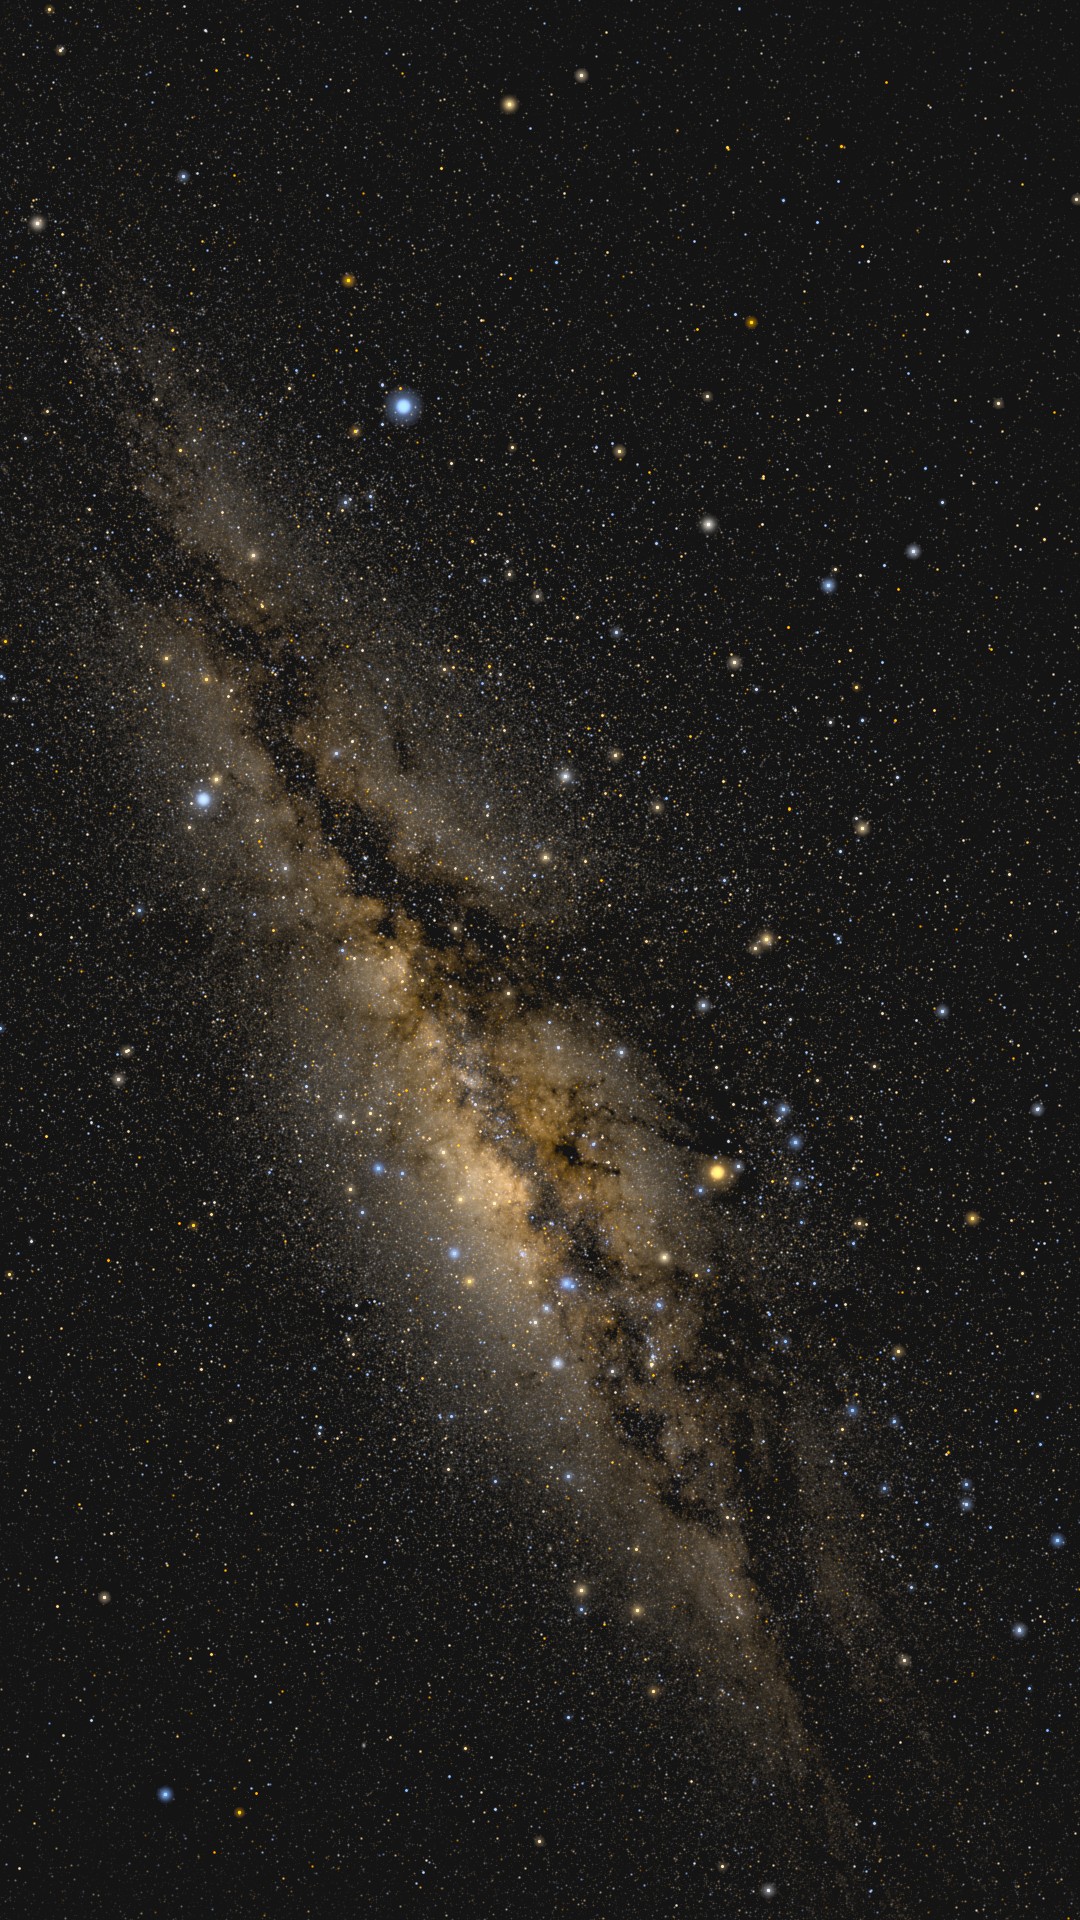
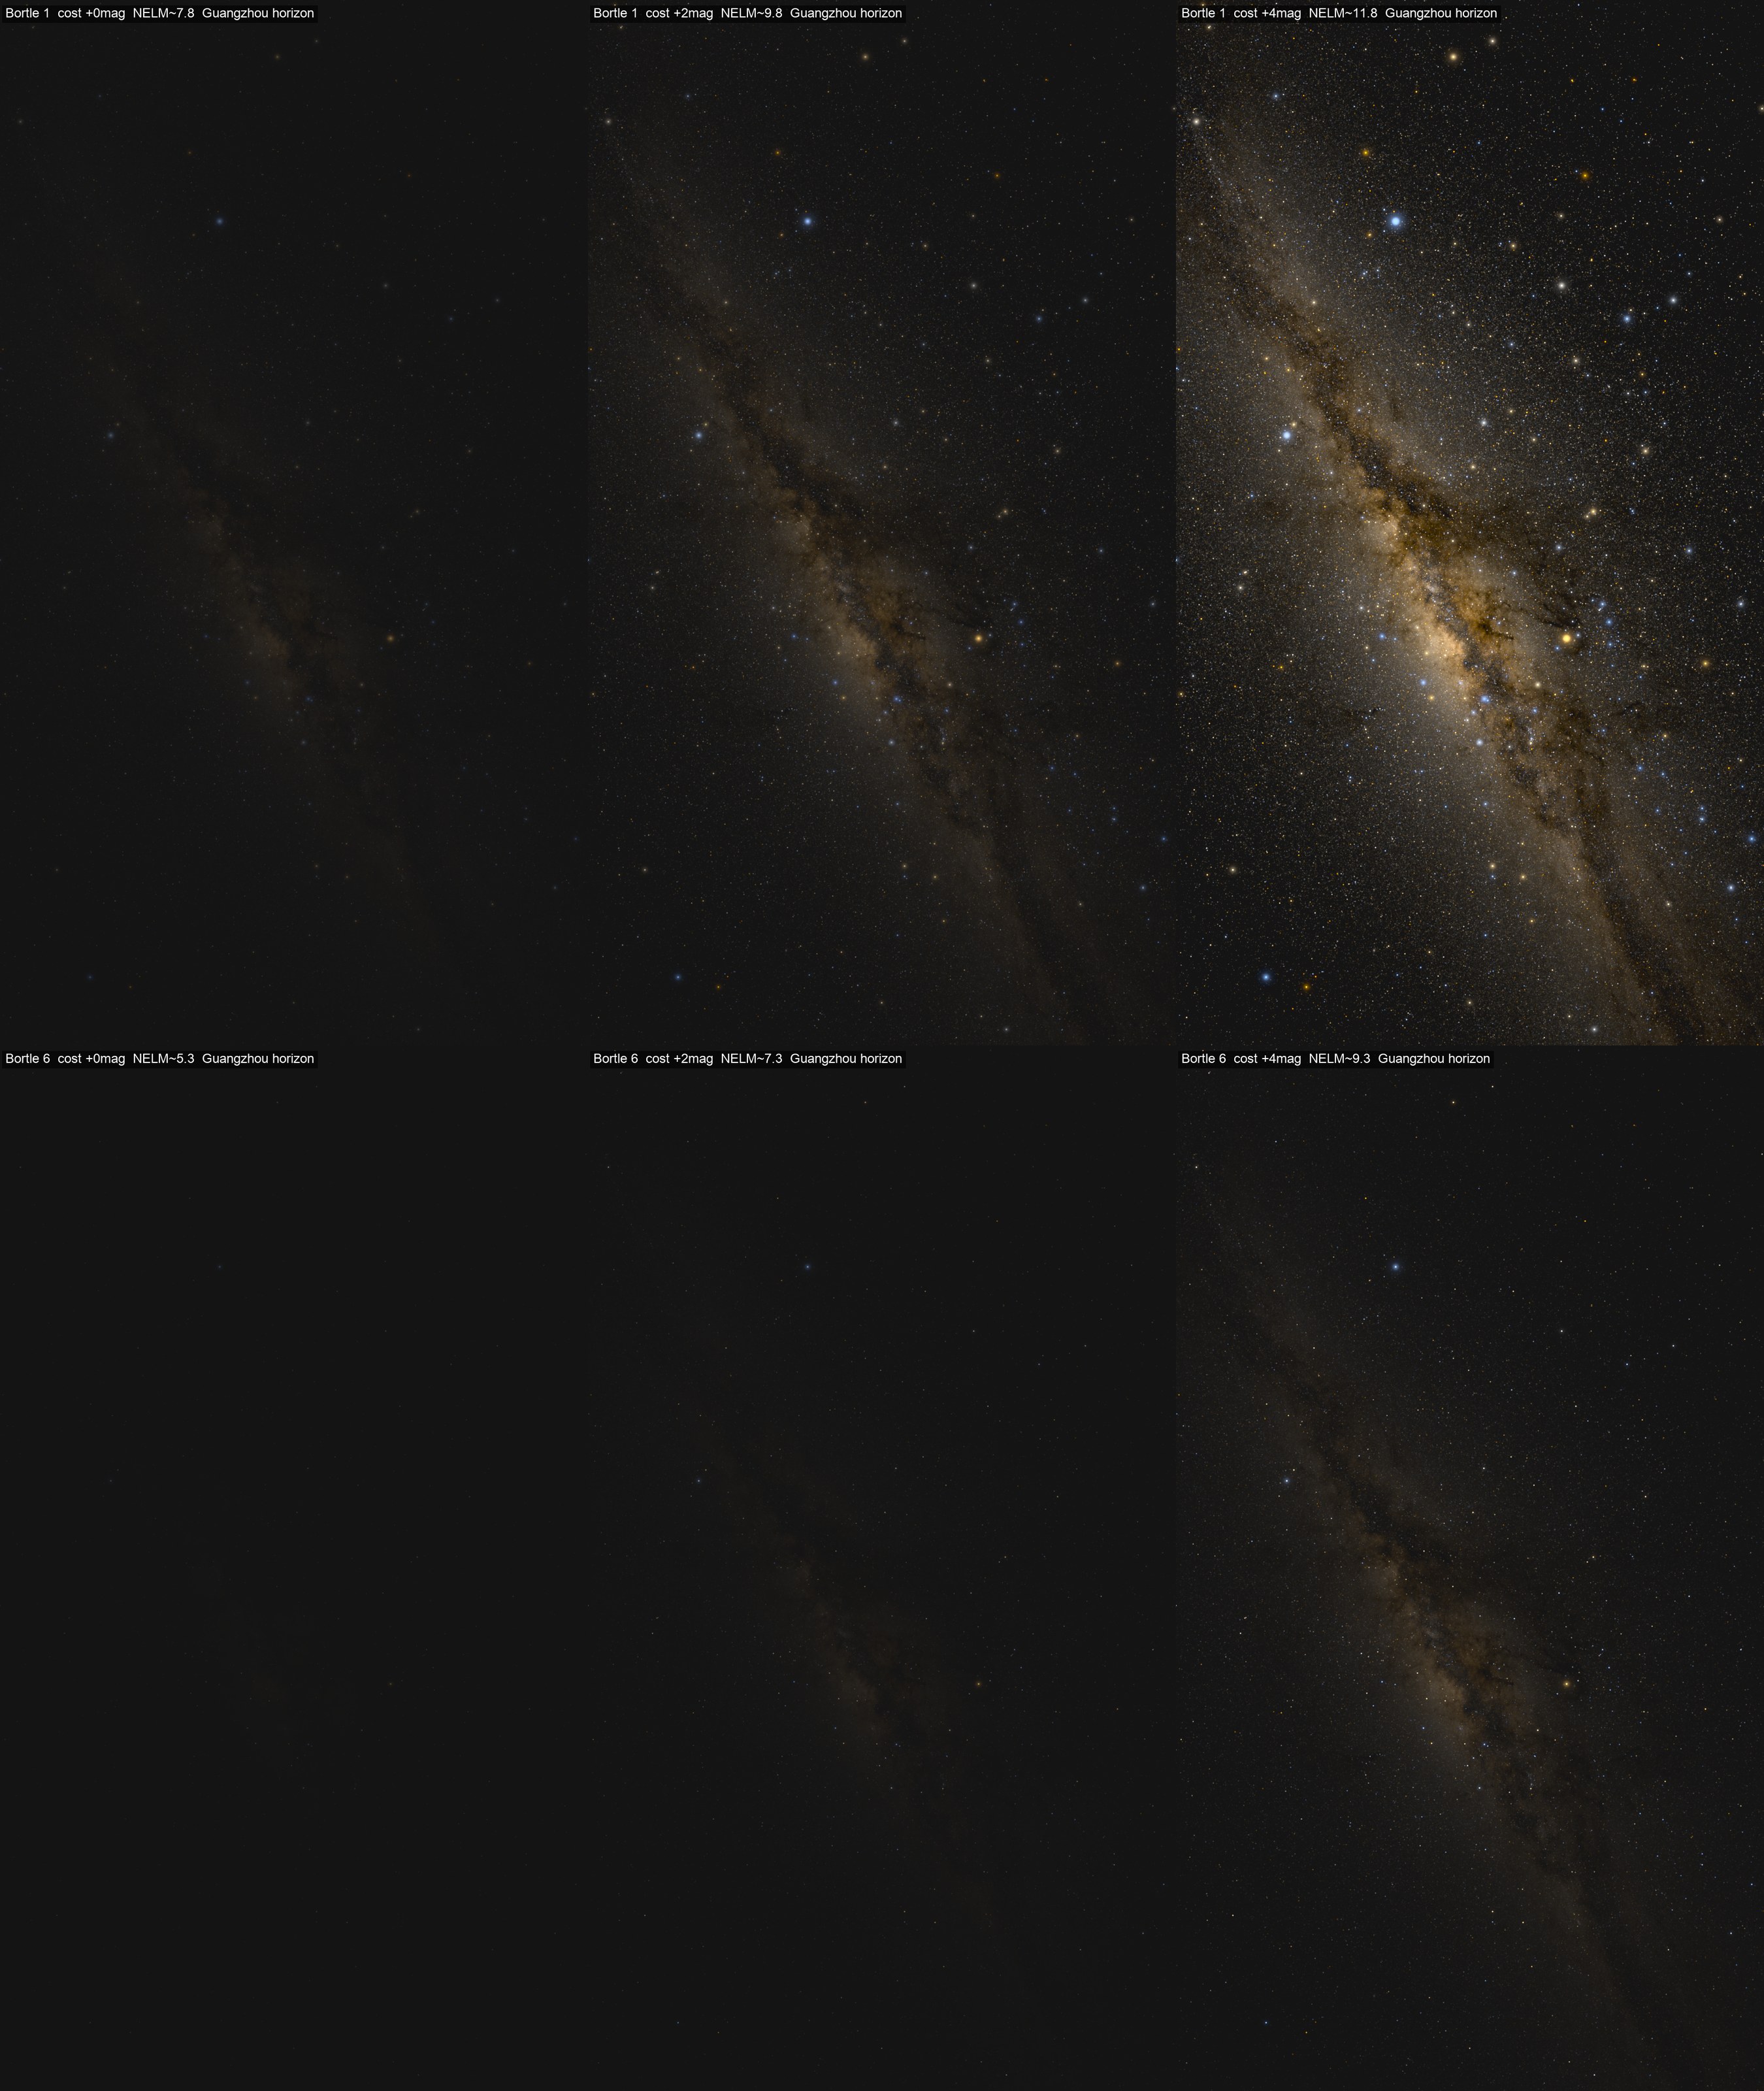
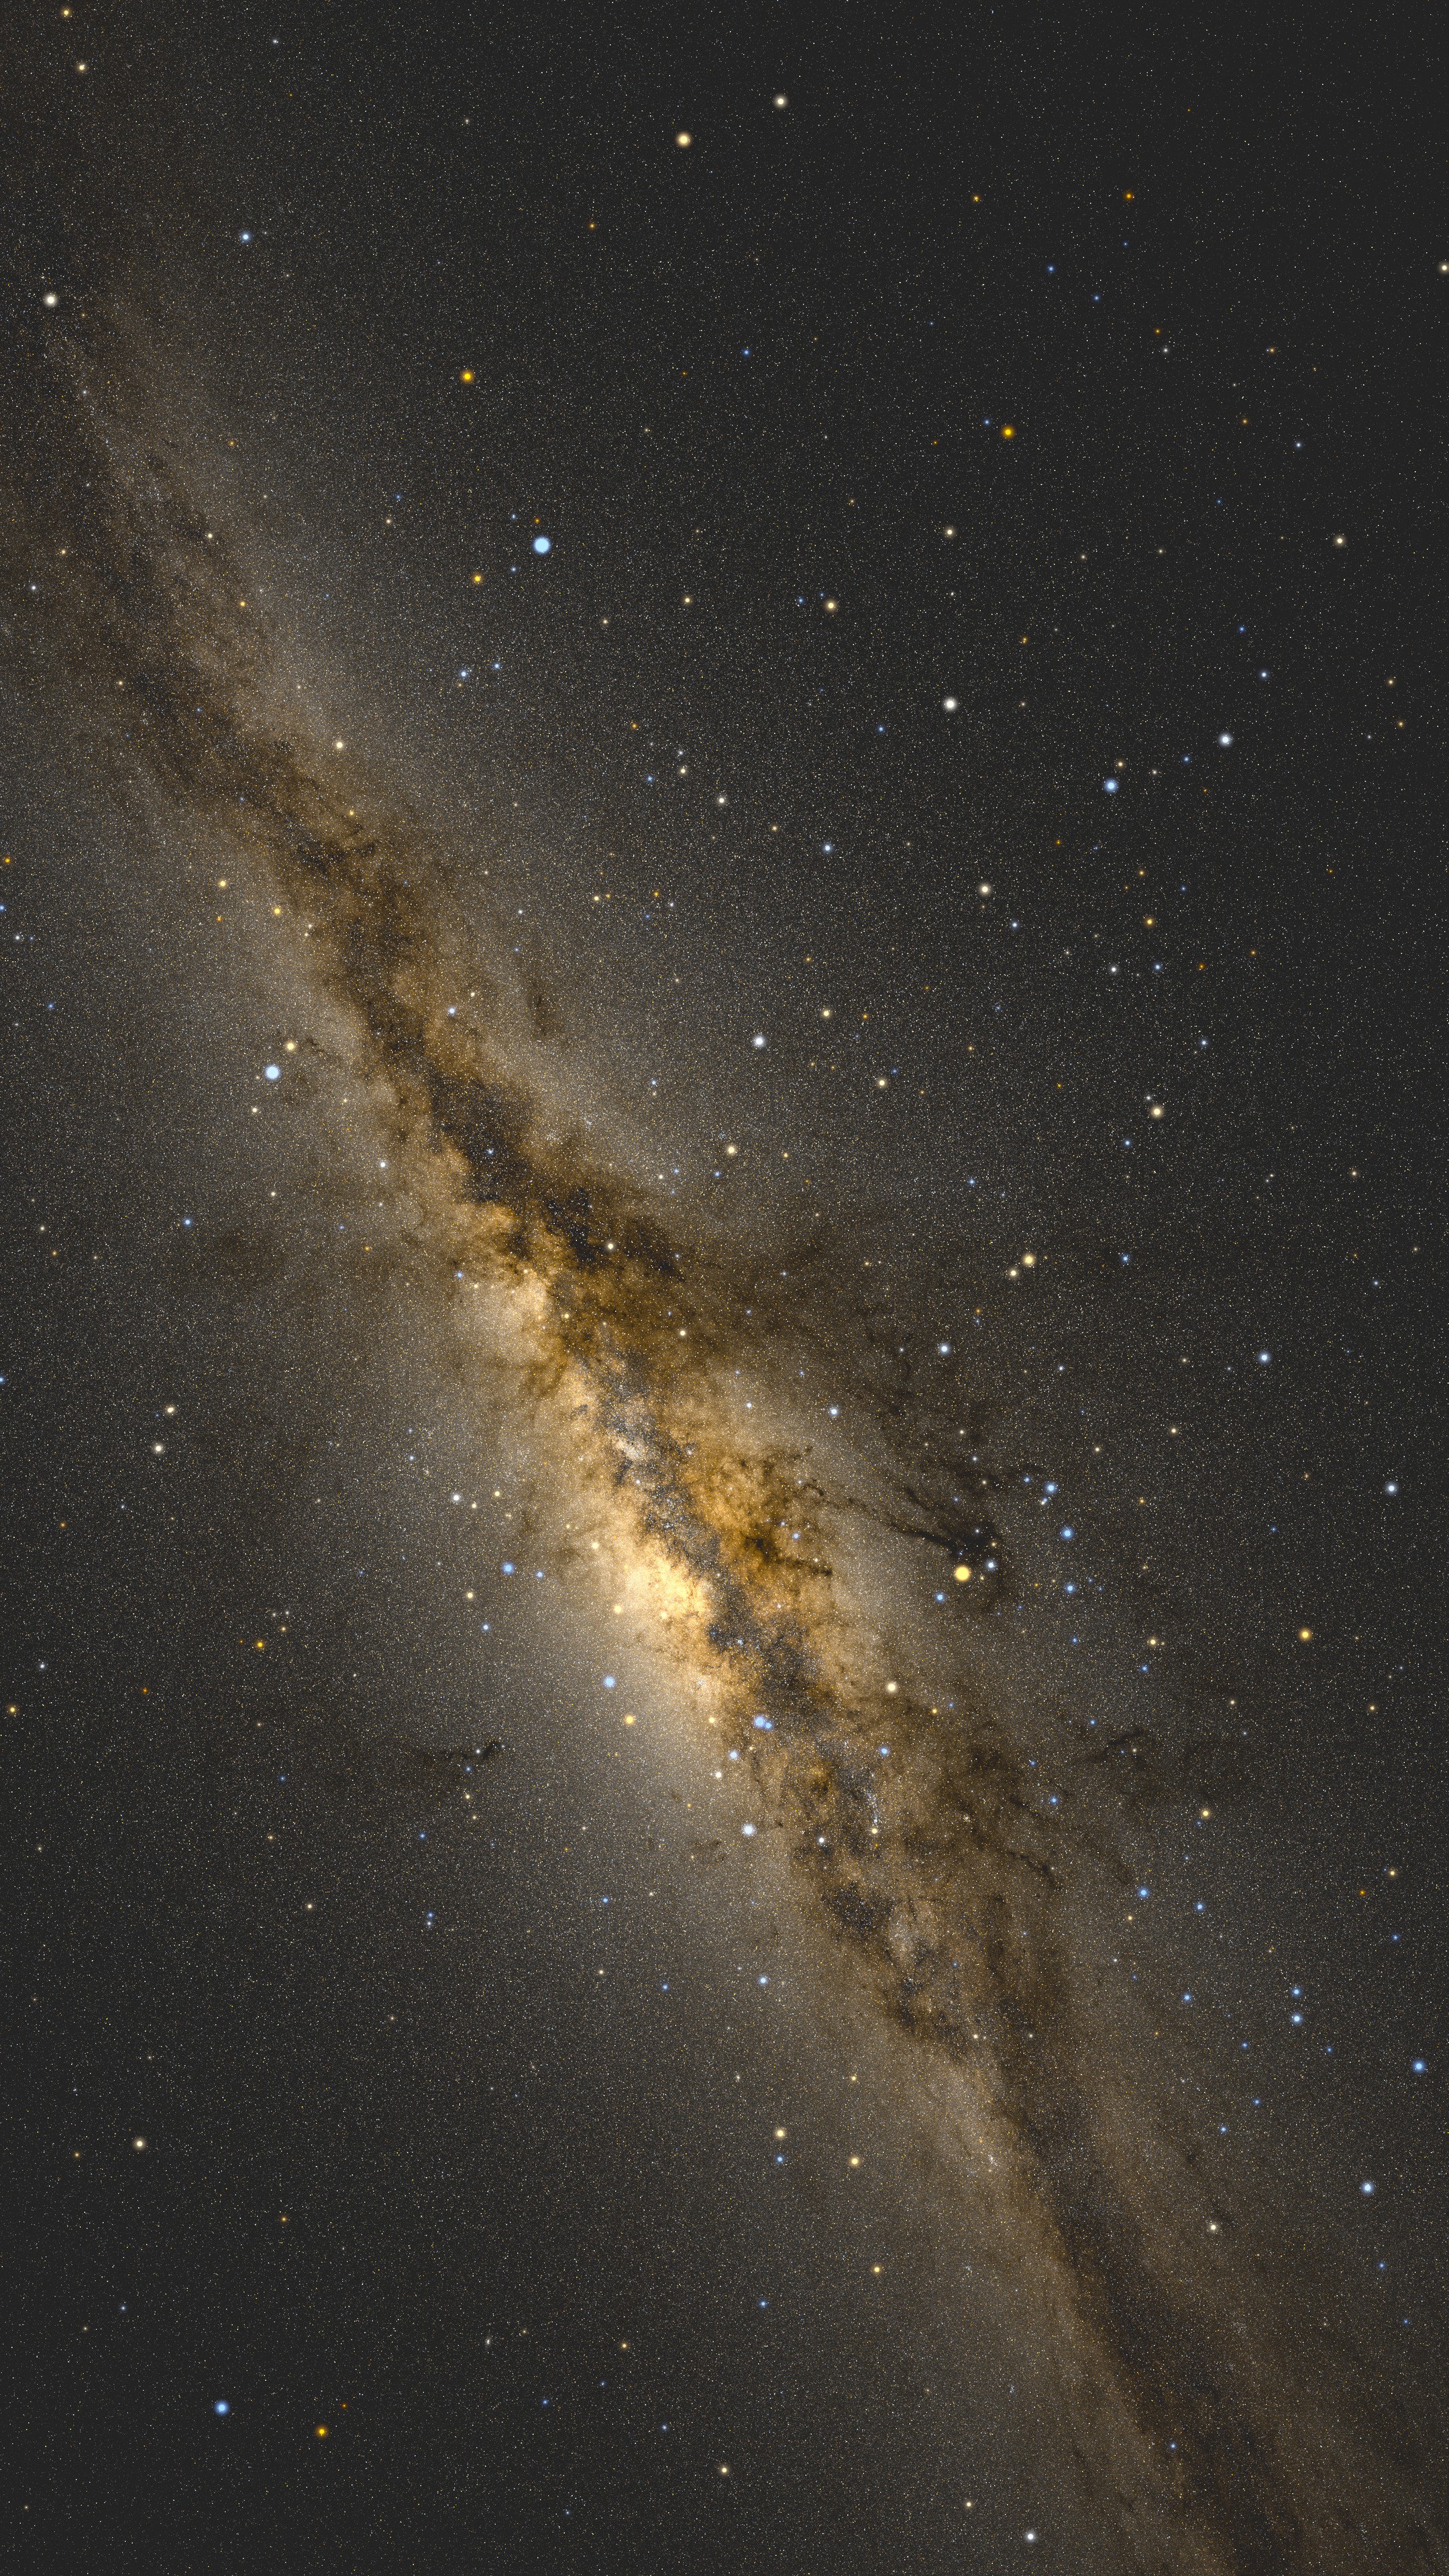
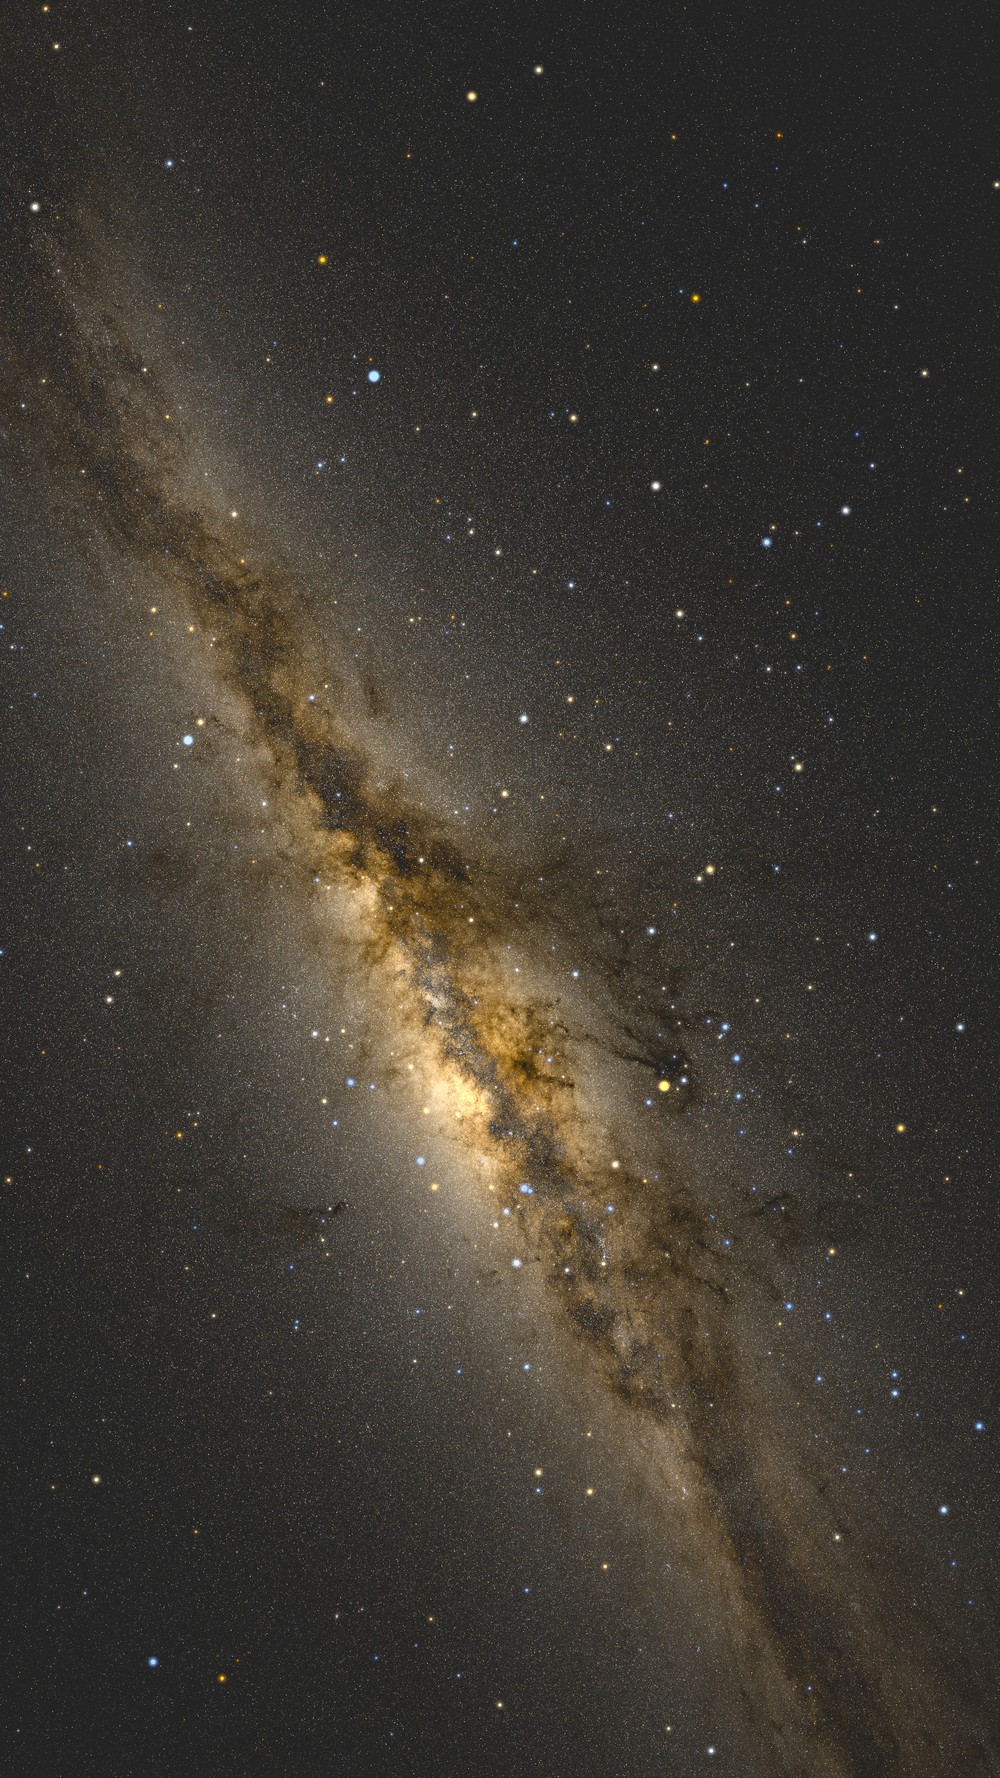
Light pollution is a layer of background glow across the sky

City lights raise the brightness of the entire sky background. The starlight itself does not change, but anything dimmer than the background vanishes from view. Most of the Milky Way is faint structure, so it disappears first. The same sky remains overhead; only the background brightness changes.

ii.

How faint a star you can see depends on how dark the sky is

Under the darkest wilderness skies, sharp-eyed observers can reach roughly magnitude 8. The often-quoted "naked-eye limit of magnitude 6" is really the level of an ordinary dark sky. In a city center, reaching magnitude 4 is already decent. Each magnitude is about a 2.5× change in brightness; going from magnitude 8 to 4 removes more than a hundredfold of the visible stars.

iii.

Constellations are angles; the Milky Way is structure

The Big Dipper looks like a ladle only because of our viewpoint from Earth. Fly a few dozen light-years in that direction and the nearby stars shift relative to one another; the ladle falls apart. The Milky Way is different: it is the distribution of billions of stars across thousands of light-years, so a flight on that scale barely changes it.

02Light Pollution / LIGHT POLLUTION · BORTLE 1–9

Sweep from Bortle 1 to 9
and watch the Milky Way fade level by level.

The Bortle scale is a common way for amateur astronomers to rate night-sky quality: 1 is a pristine remote dark sky, and 9 is an inner-city sky. Tap any level to see what the same patch of sky looks like under that condition.

Full-sky rendering under a Bortle 1 pristine dark sky B1 · SQM 21.9 · LIM ≈ 7.8
02bSensitivity Comparison / SENSITIVITY

Same sky, more sensitive eyes: what changes?

Six comparison panels of the starry sky: the top row is a dark sky, the bottom row is a bright suburban sky, and observing sensitivity increases from left to right, revealing progressively fainter stars

The top row is a pristine dark sky; the bottom row is a bright suburban sky. From left to right, the assumed limiting sensitivity of the eye, telescope, or long-exposure camera improves step by step, with each step adding 2 magnitudes to the limiting magnitude. The same gain in sensitivity can pull out the full Milky Way under a dark sky, but it helps far less under a bright sky. This is why stargazers willingly drive for hours to reach dark sites. All six panels use the same brightness baseline; the bright-sky panels have not been secretly boosted. Tap the image to view it full size.

03Interstellar Flight / FLIGHT THROUGH THE CATALOG

Leave the Solar System:
constellations fall apart, but the Milky Way remains.

FLIGHT 01 · TOWARD THE BIG DIPPER

Flying toward the Big Dipper

Gaia measured not only where stars appear on the sky, but also their individual distances, so we can compute the sky from any position. This video first flies toward the Big Dipper, with thin lines connecting the seven stars of the ladle. After a few dozen light-years, the seven stars shift relative to one another and the ladle falls apart. In the second half, the camera turns toward the Galactic disk, revealing how it extends through three-dimensional space. The video is silent.

FLIGHT 02 · 360° PANORAMA

A panoramic version of the same flight

This 360° panoramic video follows the same flight path. The image unwraps the entire celestial sphere around you into a wide frame, so the edges look stretched; that is normal for this panorama format. Put it in a VR headset or a panorama-capable player, and you can turn your head in any direction during the flight. The video is silent.

04Gigapixel / GIGAPIXEL

Over a billion stars,
projected across the full sky.

The Bortle comparisons and flight videos above still use the Guangzhou sky-region dataset of about 600 million stars. This section switches to an independent all-sky HiPS map: about 1.06 billion G≤20 stars from Gaia DR3, projected by measured position and brightness onto the celestial sphere. The Milky Way, the Large Magellanic Cloud, and the Small Magellanic Cloud are not drawn separately. They appear because Gaia measured real stellar-density structures in those directions.

A Gaia full-star rendering of the Milky Way over the Guangzhou sky region, with dark lanes and dust texture built from density variations among 600 million stars
PLATE · Gaia DR3 All-Sky · G ≤ 20 · ~1.06×10⁹ stars · shown here as a 4K compressed preview
ZOOM · Continuous zoom from the full panorama into the Galactic Center core at 1:1 scale — silent video, looping automatically

Want to explore the full celestial sphere?

The online release is the Norder 7 Lite version, roughly 50 gigapixels, with a best resolution of about 3.22 arcseconds per pixel. The rendering pipeline cuts the all-sky map into HiPS tiles, served in a standalone browser view: drag to pan, scroll to zoom. The format matches the Aladin sky atlas used by astronomers. A higher-resolution rendering is available upon request for commercial collaboration.

Open the All-Sky HiPS Map ↗
05What These Images Are Not / WHAT THESE IMAGES ARE NOT

The first boundary comes from the data. Gaia's distance measurements become less precise with distance, and only stars within a few thousand light-years around the Sun have sufficiently reliable distances. In the flight videos, the farther you fly, the sparser the stars become. That is not the edge of the universe; it is the edge of the measurements. One related point: humanity still has no real top-down photograph of the Milky Way. The common "full Milky Way galaxy" images online are imagined views inferred from observations.

The second boundary comes from the screen. In the real night sky, the brightest stars and the faintest Milky Way texture can differ in brightness by more than a millionfold, far beyond what any screen can display. The image therefore has to compress brightness before it can be shown to you. The compression preserves the relative order of what is brighter than what, but it does not preserve absolute brightness ratios. For structure, trends, and comparisons, these images are reliable. For measuring magnitudes, they are not.

06How It's Rendered / HOW IT'S RENDERED

How were these images drawn?

There is no Milky Way overlay in the image, and no hand-painted glow. Starting from the simplest idea, "one star, one pixel," we ran into five problems. Each time, adding one physically grounded rule brought the result closer to reality: first anchoring stellar colors to the white point, then applying a shared optical PSF to all stars, letting bright-star size emerge from energy-conserving saturation spillover, replacing gain extrapolation with a deeper real star catalog, and finally adding the human eye's Weber contrast threshold for diffuse light. After those five steps, the main image above appears.

Read the deep dive on rendering principles →

Code and Data Are Fully Public

The whole project is open source,
and reproducible on your own machine.

The code, data-download scripts, and all parameters are in the GitHub repository. You can regenerate every image and video on this page, or change the city latitude and light-pollution level to render a night sky of your own.

Open GitHub Repository ↗